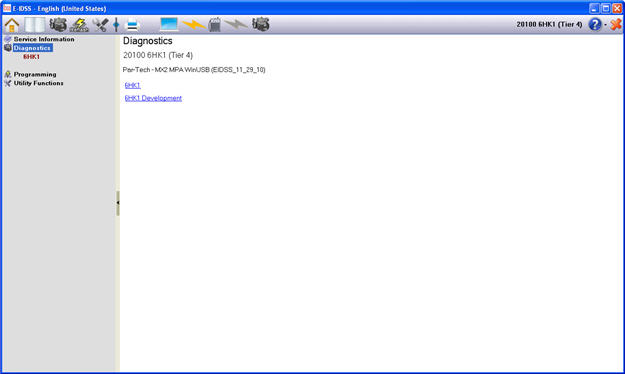
When you select the Diagnostics option from the TOC, IDSS will attempt to connect to the engine. Refer to Hardware Connections to review how to connect IDSS to the engine.
If all IDSS Interface Device and engine controller connections are ok, IDSS will connect to the engine controller and display current engine controller information.
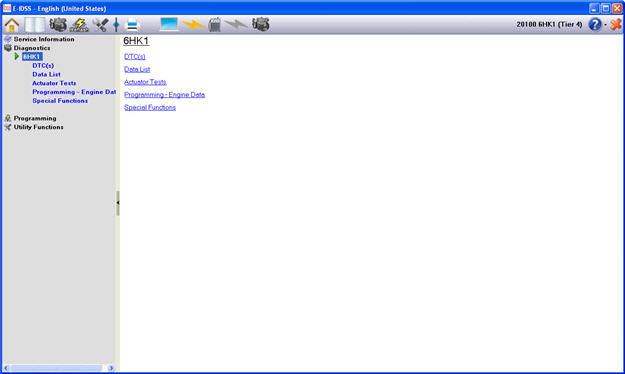
Once a connection to the vehicle has been established, the following functionality is accessible:
DTC(s)
Data List
Actuator Test
Programming
Special Functions
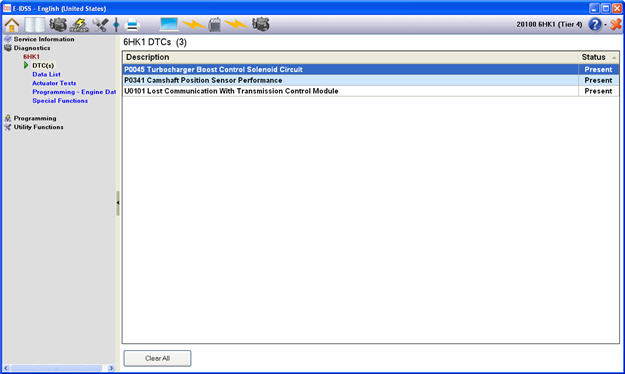
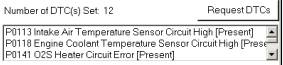
The DTC area in IDSS will provide the following information:
DTC information for each engine controller.
Clear DTC functions for all modules and each engine controller.
DTC Description:
The DTC Description screen will display DTC information for all DTCs set.
When a new DTC is set, the DTC information will display the status for current and past status DTCs.
If Freeze Frame / Failure Records are available for the module that is selected, a button will be displayed in the lower right hand corner.
The Freeze Frame / Failure Record function allows the user to request and view current Freeze Frame / Failure Record information. The user will immediately see the View Snapshot screen once the data collection process is complete.
Click the Freeze Frame / Failure Record button to request and view Freeze Frame / Failure Record information.
Upon completion of collecting data, the View Freeze Frame / Failure Record screen will appear.
NOTE: Freeze Frame / Failure Record information is not available for all components. This button will only be active for components that support Freeze Frame / Failure Records.
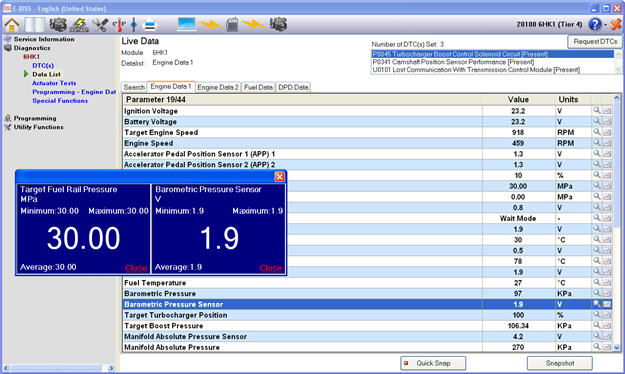
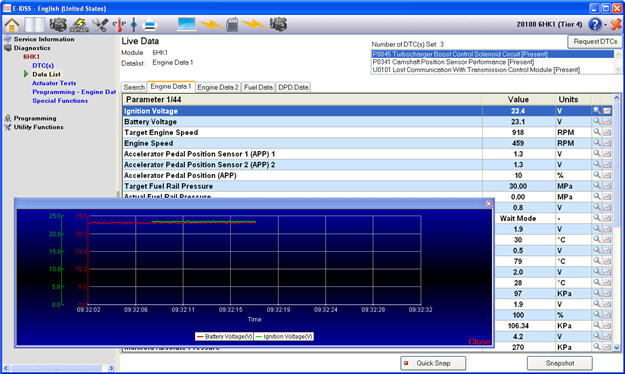
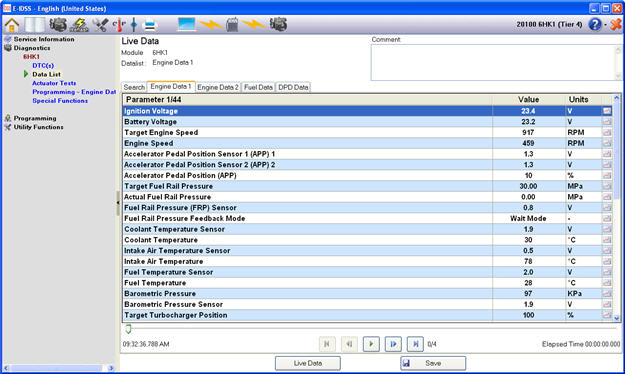
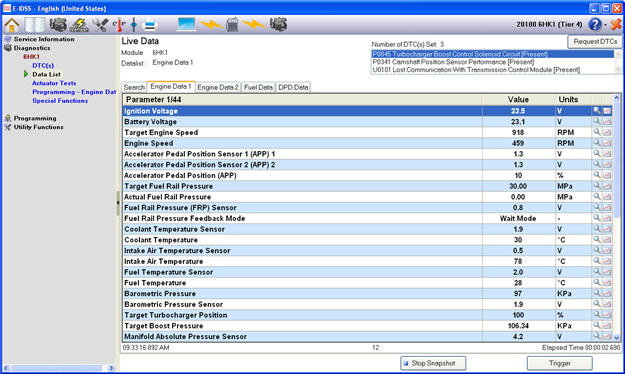
IDSS Data List functionality includes the following:
Live Data
Requested DTCs
Graph
Quick Snap
Snapshot
Zoom View
You can view Live Data information for a machine by selecting the Data List title in the TOC.
Information for each data list is displayed on a tab along with a Search tab. Click each tab to view the data list information.

The Requested DTCs information is displayed in the upper right corner of the data list page. By clicking the "Request DTCs" button, the DTCs that are set will display in the list.
Click on the DTC title to go to the DTC Info screen for the DTC selected.
When you click the Zoom Window within a parameter a new window will open. This window will display "live" values from the engine. Multiple parameters can be selected for viewing.
When you click the Graph icon within a parameter a new window will open. This window will display "live" values in graph form.
The IDSS graph function can be used as follows:
Data List information can be graphed "Live" when viewing a data list on the engine.
Snapshot information can be graphed.
Graphs can display in an "Individual" graph format or "Overlay" graph format for viewing multiple parameters. Each graph parameter will display in a different color. The graph colors can be changed, refer to Graph Colors in Utility Functions.
The Quick Snap function allows the user to capture and record data and then analyze it while viewing the data list.
Data collection begins by clicking the following button..
Begin Data Collection: Click the “Quick Snap” button to trigger to start collecting data.
![]()
End Data Collection: Click the “Stop Snapshot” button to stop data collection. The user can also add a comment to the snapshot data when it is saved.
![]()
3. Upon completing of collecting the data, the Quick Snap view will appear and the recorded data will be displayed. Please see the following “Snapshot and Quick Snap/Snapshot Display” topics for information regarding how to view data.
Quick Snap/Snapshot can be used to collect/record data for each of the currently selected data list items.
The Snapshot function is used in the same way as Quick Snap to analyze data that is collected and recorded. However, the Snapshot function is different from Quick Snap in that, depending on the situation, it is possible to change the setting conditions for the data being collected
![]()
The Snapshot Setup window will be displayed by clicking the “Snapshot” button. In this window, it is possible to set the Trigger Type (Trigger Type), the Trigger Location (Trigger Point), the total number of frames to be collected as well as the total collection time.
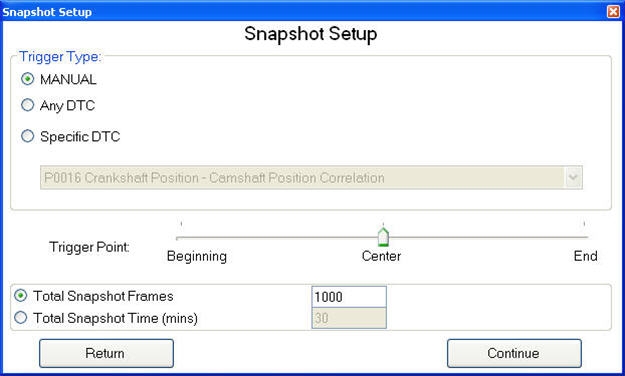
After selecting the settings or continuing with the current settings, click the “Continue” button to display Snapshot viewer or click the “Return” button to return to live data. (Please reference “Snapshot Setup” for information regarding settings.)
When Manual Trigger Type is selected, and the Trigger button is clicked, frame recording will begin. If a DTC is set (DTC is detected) and DTC Trigger is selected, the Trigger function will automatically start almost simultaneously.
When the “Stop Snapshot” button is clicked, data collection or recording will stop, no matter what point they are at.
The data list information for the Quick Snap / Snapshot will display in the Quick Snap/Snapshot window. The collected data for the module and the data list name will be displayed in the upper left corner of the screen (above the data list).
In order to view or analyze the recorded data, use the buttons located in the lower area of the screen to transition to different data locations (frames).
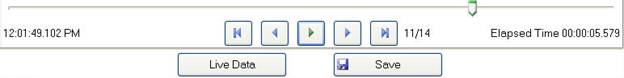
The functionality for the Quick Snap/Snapshot data screen are listed below:
![]() /
/![]() Play/Pause:
Plays or pauses the data.
Play/Pause:
Plays or pauses the data.
![]() Previous
Frame: Moves Snapshot view to the previous frame.
Previous
Frame: Moves Snapshot view to the previous frame.
![]() Next
Frame: Moves Snapshot view to the next frame.
Next
Frame: Moves Snapshot view to the next frame.
![]() First
Frame: Moves Snapshot view to the first frame.
First
Frame: Moves Snapshot view to the first frame.
![]() Last
Frame: Moves Snapshot view to the last frame.
Last
Frame: Moves Snapshot view to the last frame.
Scroll Bar: Indicates the relative position of the frame in the overall Snapshot. The scroll bar can also be used to quickly move to a different location.
Scroll Bar Picture: ![]()
![]() Save:
Opens the Manage Saved Snapshot screen, where selected data can be saved.
Save:
Opens the Manage Saved Snapshot screen, where selected data can be saved.
![]() Live Data: Return to the “Live Data” screen.
Live Data: Return to the “Live Data” screen.
The following three Trigger Types are available:
Manual Trigger: Begins collecting data from any selected trigger location in the Snapshot.
DTC Trigger: Without specifying a DTC, begins data collection for any set DTC.
Specific DTC Trigger: Begins data collection only for a specific set DTC.
(When a DTC already exists and is detected, it is only possible to use the Manual Trigger of the Snapshot function.)
When the manual trigger function is used, you can freely move from data collection to recording. When the “Stop” button is pressed during data collection, data collection will end and it is possible to view the collected data. This function is helpful for DTCs that are not set and for determining what data to record while looking at Live Data.
Independent of Trigger Type, Trigger Point will always be displayed as Frame 0. Frames recorded before the trigger will have negative numbers while frames recorded after that will have positive numbers. In addition, even if you are already in Snapshot, you can exit Snapshot without using the trigger function.
The manual trigger function allows the user to immediately record live data (frames) when the TRIGGER button is pressed. When the STOP button is pressed, it will end the manual trigger function. This captured data can now be reviewed. This function is helpful if a problem is detected that is not supported by a DTC.
The user will record a trigger point in the snapshot by pressing the Trigger button on the Live Data screen . The trigger point is recorded by the software as Frame 0. Data frames recorded before the trigger will have negative frame numbers. Data frames recorded after the trigger will have positive frame numbers. Frame number 0 indicates the manual trigger point. This features exists for the user to mark a point in the snapshot data where they may observe a condition with the vehicle or engine that cannot be detected by software. The user may stop the snapshot without recording a trigger.
Depending on the investigation conditions and analysis of data content, it is possible to change the Trigger Point.
Beginning: Designated data is collected from the Trigger Point.
Center: Half of the data collection will be on each side of the Trigger Point. (The amount of data stored before the trigger point may be less than half of the specified data amount if the trigger occurs in a short period of time after entering the Snapshot function.)
End: Collect data prior to the Trigger Point. (The amount of data stored before the trigger point may be less than half of the specified data amount if the trigger occurs in a short period of time after entering the Snapshot function.)
The Snapshot data collection amount can be changed by changing the number of frames or the collection time. (It is not possible to change both the number of frames and the collection time at the same time.)
Total Snapshot Frames: In Snapshot, sets the total number of frames to be collected and recorded. However, even if the setting is for more than the maximum number of frames, only the maximum number of frames will be recorded.
Total Snapshot Time: In Snapshot, sets the total amount of time that data will collected and recorded. Even if the setting is for more than the maximum recording time, only the maximum amount of time can be recorded.
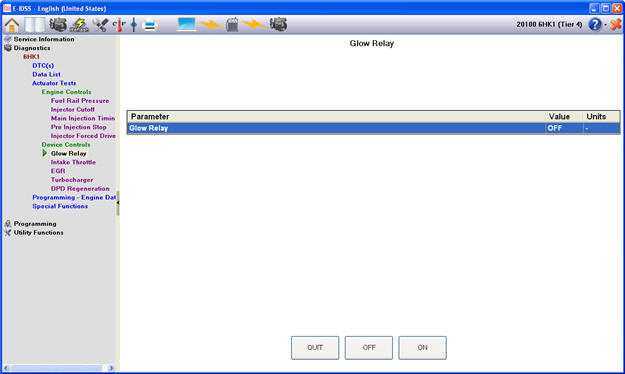
The parameter data related to each actuator test is displayed and it is possible to display this data during the test.
The engine condition information that is necessary to perform the test is displayed on the screen. Please perform the test using these displayed conditions.
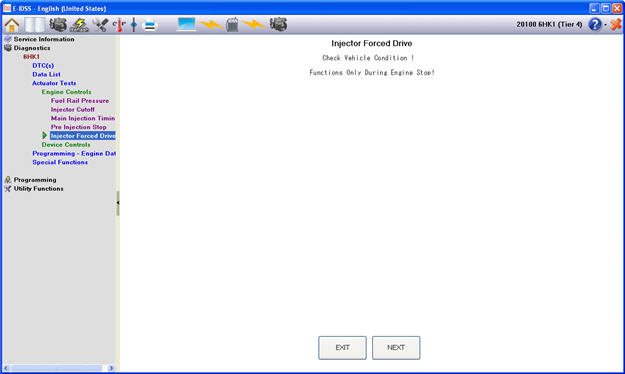
The buttons that control the test are on the bottom of the screen. Click the appropriate button to perform the output test selected.
The Quit button must be selected to stop the current test before selecting another test or a new selection from the TOC. To end the test, please select the Quit button. There are many different types of buttons. To review the details regarding buttons, please see the explanation in the Test Mode section.
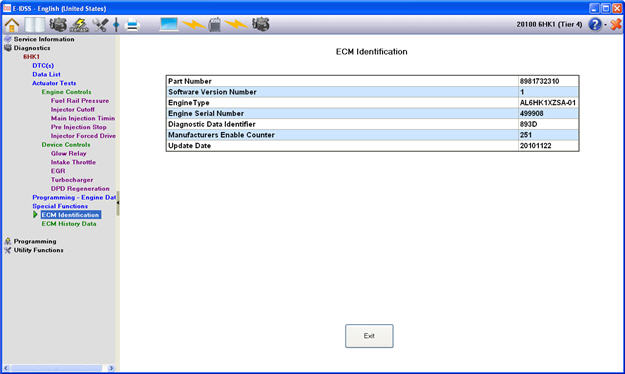
ECM Information contains the ECM information for the machine that is connected.
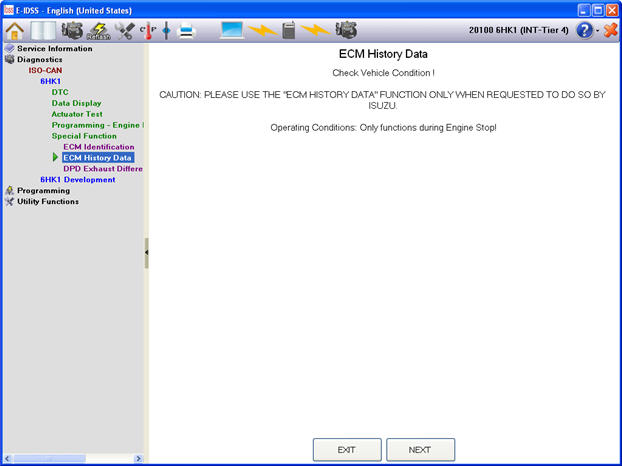
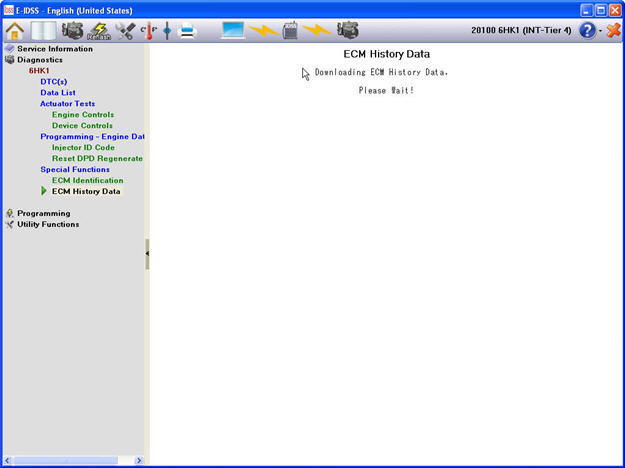
This function gathers the ECM history data which is stored in the ECM.
Please use the ECM History Data function when requested to do so by Isuzu.
To run ECM History Data there are preconditions that must be met (Engine Speed must be 0).
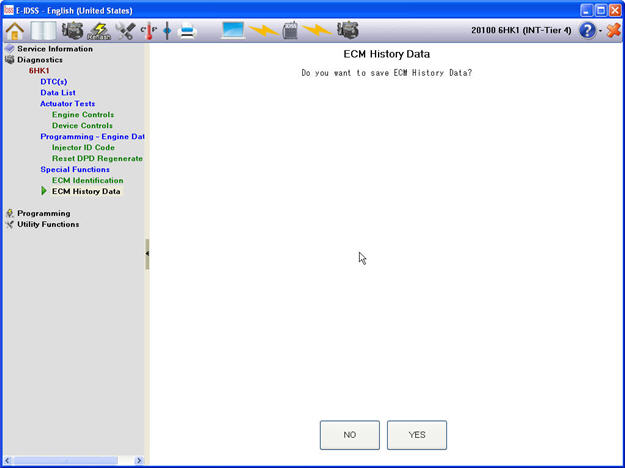
After preconditions are met, the user will be asked if they would like to save the ECM History Data. When the Yes button
is pressed, the ECM history data is saved to the PC.
Downloading `
A confirmation screen will appear to let the user know the data has been downloaded successfully
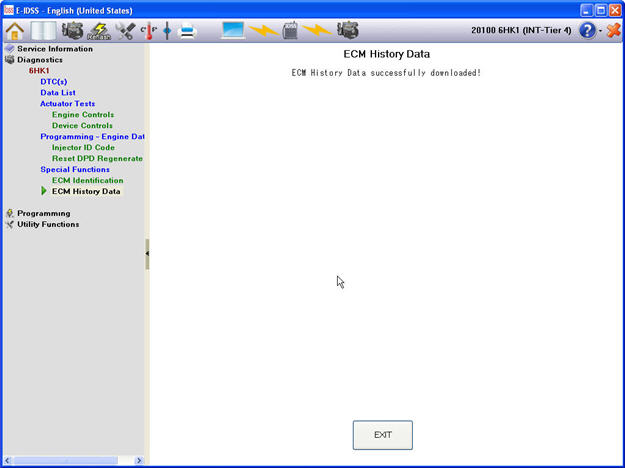
The file that will be stored in the PC will be stored in the following location: C:\Program Files\G-IDSS\Data\History Data Download
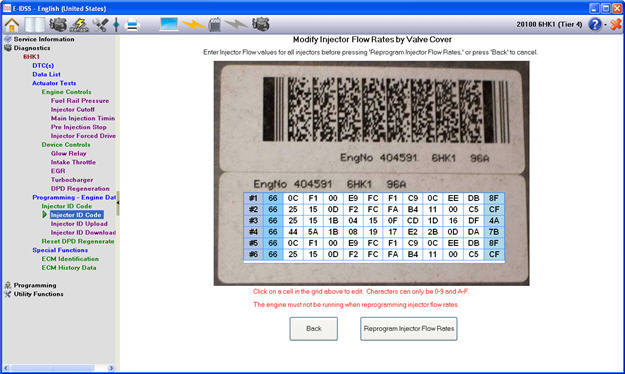
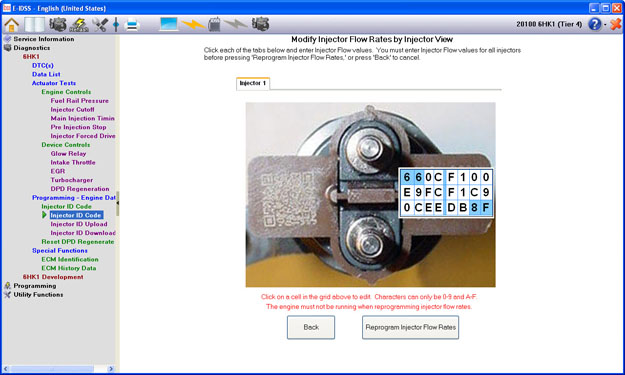
By selecting the Injector ID Code from the TOC, it is possible to use the Injector ID change function. Once you select Fuel Injector Flow Rates, IDSS will communicate with the ECM and display current Injector ID Code.
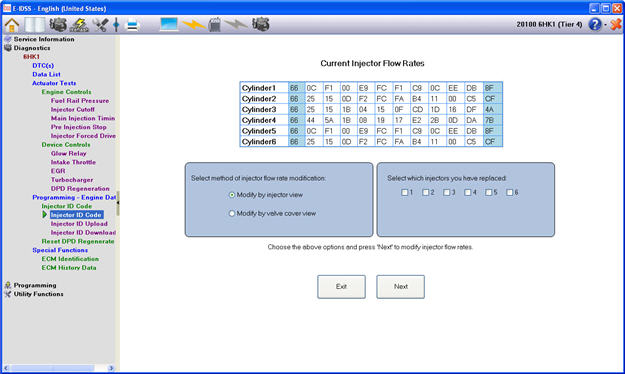
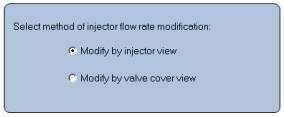
You can modify flow rates using the following methods:
Modify by Injector View
Modify by Valve Cover View
To modify by injector view:
Choose "Modify by Injector View."
Select the injectors to program.
Click the Next button.
The current values for each injector you selected to program will display on a tab. Select the tabs to modify the values.
Type the new values in the edit boxes and click the Reprogram Injector Flow Rates button.
If any incorrect values are entered, IDSS will prompt you to correct the problem.
NOTE: The engine must not be running when injector ID is programmed.
Once correct values are accepted, proceed by following the on screen instructions.
To modify by valve cover view:
Choose “Modify by Valve Cover View.” You do not have to select injectors to program.
Click the Next button.
The current values for all injectors will display.
Type the new values in the edit boxes and click the Reprogram Injector Flow Rates button.
If any incorrect values are entered, IDSS will prompt you to correct the problem.
NOTE: The engine must not be running when fuel injectors are programmed.
Once correct values are accepted, follow the on screen instructions to program the flow rates.